Fed up
Yield curve predictions are hitting the headlines again here, here, and here, though they’re not quite front page. The alarm bells are ringing since the probability of a recession appears to have increased meaningfully in the past few months. We look at the data to try to infer whether a recession is around the corner.
So what is it that has ruffled everyone’s feathers? The NY Fed’s yield curve model estimates the probability of a recession in the next twelve months at an exceedingly precise 27.4893%. I usually set the probability of the sun coming up tomorrow at 99.9997%. But some days, its 99.9993%. Here’s the graph we’re talking about:
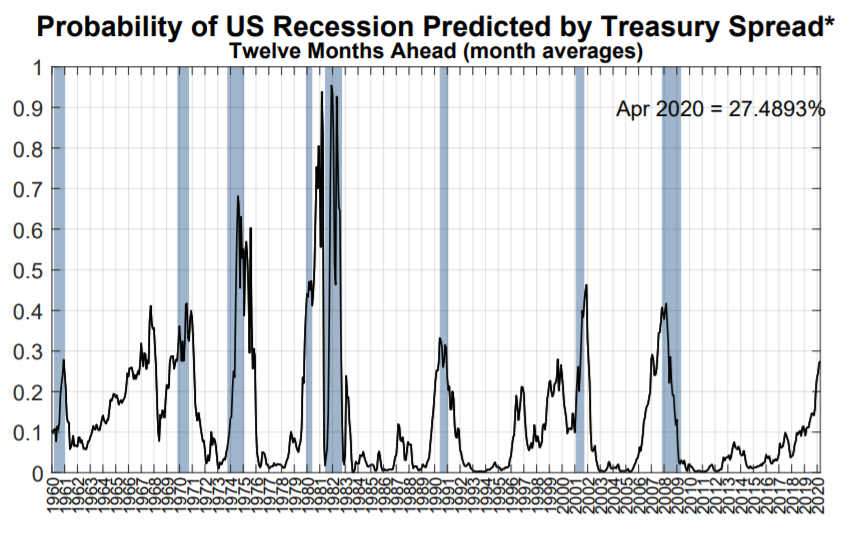
You can find the graph here.
First, a couple of things to notice. The Fed model starts with 1959. The models we used in previous posts start in 1953. May or may not be relevant. A cursory read of the papers on the model doesn’t specify why it starts in 1959, especially since it effectively misses recessions in 1953, 1954, 1957, and 1958.
Let’s see if we can recreate this graph.
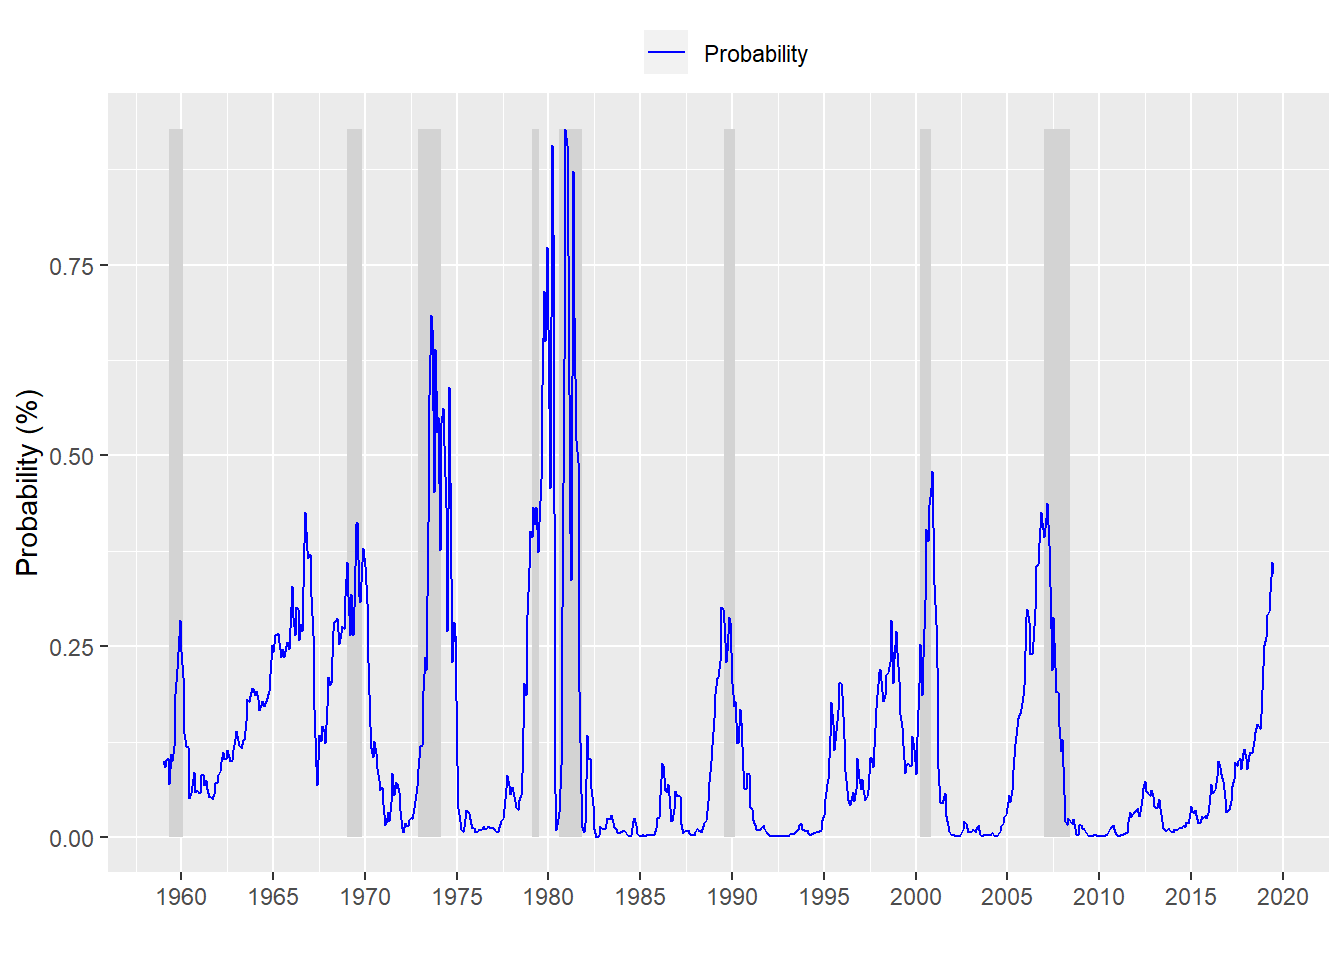
Looks pretty similar, although this is not a post about graphics. The point is that we were able to reproduce a fairly similar model. The probabilities are diffferent by about 7bps on average. That’s probably meaningful! Actually, the differences can be pretty extreme at some points but we won’t go into that here. Let’s compare to the different predicted outcomes between our copy of the NY Fed model and the actual model.
Our results:
| Predicted/Actual | No recession | Recession |
|---|---|---|
| No recession | 624 | 79 |
| Recession | 10 | 14 |
Our accuracy is 15.1%.
And here are the Fed’s results:
| Predicted/Recession | No recession | Recession |
|---|---|---|
| No recession | 620 | 77 |
| Recession | 11 | 16 |
The Fed’s accuracy is 17.2%.
The Fed’s accuracy is a bit higher that our copy model, but not meaningfully. What is relevant is that both models have seen the probabilities of recession 12-monhts hence increase. Let’s cut to the question: should we care that the probability of a recession has increased 20.7 percentage points in the last year on our mock Fed model? Not in isolation. The critical point is that it’s tough to say whether a 10 percentage point increase is any more meaningful than 5 point increase. Running another table:
| Probability/Recession | No recession | Recession |
|---|---|---|
| Less than 10 pts | 549 | 43 |
| More than 10 pts | 85 | 50 |
When our mock model probability increases by 10 pts over the last year, a recession occurs in the next 12 months 37% of the time.
But don’t take our word for it. And how does that look using the Fed data?
| Probability/Recesion | No recession | Recession |
|---|---|---|
| Less than 10pts | 550 | 43 |
| More than 10 pts | 81 | 50 |
When the Fed’s model probablity increases 10 pts year-over-year, a recession has occurred in the next 12 months 38% of the time.
So there you have it. In the past there wasn’t even a 50/50 chance the US would see a recession in the next 12 months even when the probabilities have increased.
And just for giggles what about 24 months?
| Probability/Recesion | No recession | Recession |
|---|---|---|
| Less than 10pts | 550 | 43 |
| More than 10 pts | 81 | 50 |
We don’t even need to run the calculation to see that the outcomes are relatively the same. We can, of course, cut the data a whole bunch of different ways. But suffice it to say the data don’t suggest that just because the probability has increased that it’s any more likely to mean a recession is around the corner. Don’t fear the Fed.
Here’s the code;
# Load packages
library(tidyquant)
library(printr)

# Load data
df <- readRDS("yield_curve.rds")


# Process data
df_fed <- df %>% mutate(usrec = lead(usrec, 12, default = 0)) %>%
  filter(date > "1958-12-31")

# Create model
model_fed <- glm(usrec ~ time_spread, df_fed, family = binomial(link = "probit"))

# Predict on test set
pred_fed <- predict(model_fed, df_fed, type = "response")

# Plot probabilities
df_fed %>%
  mutate(prob = pred_fed) %>%
  ggplot(aes(x = date)) +
  geom_ribbon(aes(ymin = usrec*min(prob), ymax = usrec*max(prob)), fill = "lightgrey") +
  geom_line(aes(y = prob, color = "Probability")) +
  scale_colour_manual("",
                      breaks = c("Probability"),
                      values = c("blue")) +
  scale_x_date(date_breaks = "5 years", date_labels = "%Y") +
  ylab("Probability (%)") + xlab("") + ylim(c(min(pred_fed), max(pred_fed))) +
  theme(legend.position = "top", legend.box.spacing = unit(0.05, "cm"))

# Confusion matrix of model results
probs_fed_probit <- rep(0,nrow(df_fed))
probs_fed_probit[pred_fed > 0.5] <- 1
tab_fed_probit <- table(Predicted = probs_fed_probit, Actual = df_fed$usrec)
rownames(tab_fed_probit) <- c("No recession", "Recession")
colnames(tab_fed_probit) <- c("No recession", "Recession")
tab_fed_probit

# Load data
fed <- read_csv("NYFed_yld_curve_data.csv")
fed$Date <- as.Date(fed$Date, "%m/%d/%Y")
fed$Rec_prob <- lead(fed$Rec_prob, 12, default = 0)
fed <- fed[-c(725:736),]
fed <- fed %>%
  mutate(rec = lead(NBER_Rec, 12, default = 0))

# Confusiont matrix of fed results
fed_probs <- rep(0, nrow(fed))
fed_probs[fed$rec_prob > 0.5] <- 1
fed_table <- table(Predicted = fed_probs, Recession = fed$rec_lead)
rownames(fed_table) <- c("No recession", "Recession")
colnames(fed_table) <- c("No recession", "Recession")
fed_table

# Confusion matrix or probability increase
table <- df_fed %>%
  mutate(prob = pred_fed,
         norm_rec = lag(usrec, 12, default = 0),
         acc_prob = c(rep(0,12), diff(pred_fed, 12, dedault = 0)),
         prob_count = ifelse(acc_prob > 0.1,1,0))

tab <- table(Probability = table$prob_count, Recession = table$usrec)
rownames(tab) <- c("Less than 10 pts", "More than 10 pts")
colnames(tab) <- c("No recession", "Recession")
library(printr)
tab

# Confusion matrix probability acceleration
fed_tab_acc <- fed %>%
  mutate(prob_acc = c(rep(0,12), diff(rec_prob, 12, defeault = 0)),
         prob = ifelse(prob_acc > 0.1, 1, 0))

fed_table_1 <- table(Probability = fed_tab_acc$prob, Recesion = fed_tab_acc$rec_lead)
rownames(fed_table_1) <- c("Less than 10pts", "More than 10 pts")
colnames(fed_table_1) <- c("No recession", "Recession")
fed_table_1

# Confusion matrix probability acceleration next 24 months
fed_tab_acc_1 <- fed_tab_acc %>%
  mutate(rec_24 = lead(NBER_rec, 24, default = 0))
fed_table_2 <- table(Probability = fed_tab_acc_1$prob, Recesion = fed_tab_acc_1$rec_24)
rownames(fed_table_2) <- c("Less than 10pts", "More than 10 pts")
colnames(fed_table_2) <- c("No recession", "Recession")
fed_table_1